
The Top Google Analytics Metrics You Should Be Tracking for Your Business in 2023
The world of web analytics is vast and profound, with many acronyms, statistics, and confusing metrics that are exceptionally hard to decipher.

And Google Analytics is certainly no exception, especially with the most recent release of Google Analytics 4.
Just when you thought you kind of sort of had some things figured out in Google Analytics, they throw a wrench at you with the recent release of GA4. And there are a lot of changes to unpack.

So, if you’re feeling a bit lost, first of all, take a deep breath because you’re not alone. Sit back, relax, and read up as we explain the most important new features for you and reveal exactly how you can harness their power to grow your business.
What Changed in Google Analytics 4?

GA4 was designed to have a higher degree of flexibility, improved graphics, and more robust features than its predecessor. The biggest change is how GA4 interacts with and collects data in comparison to Universal Analytics (UA).
Universal Analytics uses a slightly different collection method than GA4 does. While UA typically measures and reports statistics based on user sessions and page views, GA4 categorizes every user interaction as a separate event, be it page views, conversions, or clicks.
So what does that mean in the overall gist of things? Well, consider that you threw a massive party in the Hollywood Hills. Rather than reporting on the total number of visitors who came to your party, purchased your alcohol, or left before stepping foot into your house, you could track where a user went over the course of the night, what that user purchased, and which demographic they belonged to.

So, in terms of GA4, this means that GA4 statistics are considerably more focused on the user journey as opposed to the overall page visitors. Thus, you’re able to more accurately track users who engage in different activities on your website, as opposed to just the total users.
The Most Important GA4 Metrics to Pay Attention To
Metrics are quantitative statistics used to measure a user’s activity during a browsing session on your website. This occurs from the second they enter your site to the minute they leave or remain inactive for 30 minutes or more. Most of the key metrics from UA were migrated over to GA4, but there are some new updates and changes worth explaining.
Let’s review the key statistics and updates you should utilize in GA4.
Engagement Rate
What It Is: An engaged session is considered to be any user session that lasts for at least 10 seconds, includes two different page views, and has 1 conversion event (which is a user completing a desired action such as subscribing to a newsletter, purchasing an item, etc.).
What it Means: Essentially, engagement rate is a measure of your audience’s interaction with your content. A low engagement rate isn’t a good sign and is usually a strong indicator that something about your page isn’t resonating with your audience.
Tip: Consider reevaluating your UX, copy, and/or graphic design to encourage a design that is more conducive to your site’s conversion goals.
Conversion Rate
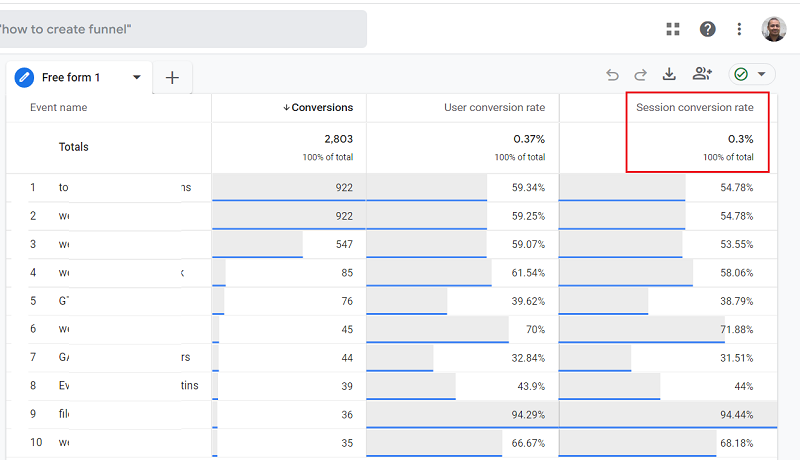
What It Is: The conversion rate is the ratio of users who complete a desired action (i.e., making a purchase, booking an event, signing up for your email newsletter) on your website. GA4 allows you to specify which conversion event you wish to measure, making it easier than ever to measure the results of specific campaigns.
What It Means: Conversion rate measures the overall ROI of your marketing efforts and provides critical insight into the effectiveness of your website as a whole. It gives you a direct peek into how well specific aspects of your website function and can help you understand which user flows may need revising.
Tip: If certain conversion events have a lower conversion rate, consider revising the call to action. Simple A/B testing of your CTA can prove exceptionally valuable in determining the clarity of your messaging.
Acquisition Source
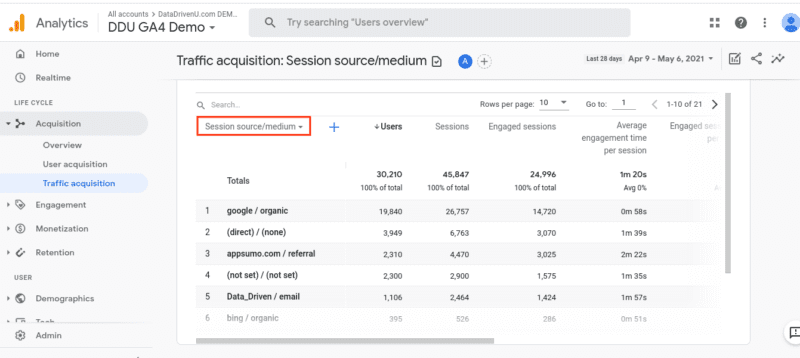
What It Is: Acquisition source, as the name implies, measures where your website’s visitors were acquired. This can include things like social media sources, search engines, or direct traffic. By accessing site backlinks and tracking, Google Analytics is able to determine where each user came from before making their way to your website.
What It Means: By understanding which channels are directing the most traffic to your site, you can further concentrate your targeted efforts with those channels and boost marketing efforts in all of the right places.
Tip: Consider dropping any paid acquisition sources with subpar results and concentrating those efforts elsewhere. Influencer marketing and organic advertising may provide better results.
Events
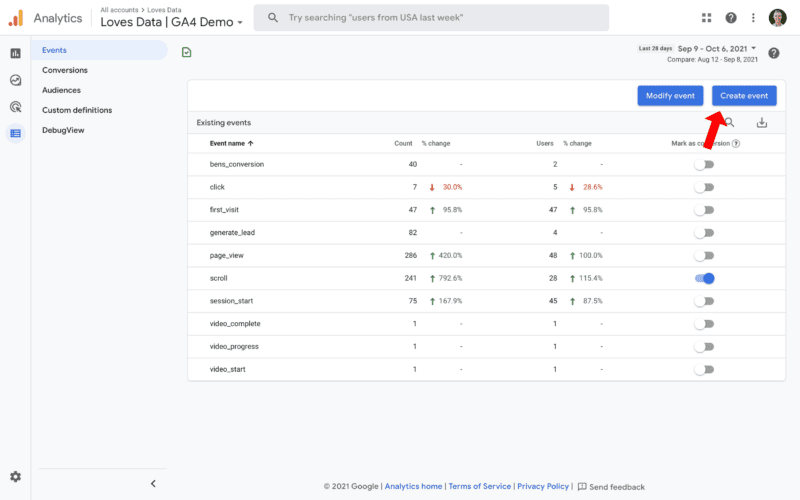
What It Is: In GA4, events can be any action that you wish to be tracked (aside from page views). This can include things like form downloads, button clicks, or video plays. Essentially, with the update to GA4, anything and everything is considered an event. There are four particular types of events that are important to distinguish, including:
- Recommended Events– Recommended events can be found in your standard reports and are typically only used when you run a specific type of event like a purchase or generate_lead event.
- Enhanced Measurement Events– These types of events don’t need extra coding changes and can be found when enhanced measurement is allowed for web data streams.
- Automatically Collected Events– As long as you have GA4 installed, these types of events are collected by default.
- Custom Events– Custom events will not show up in your standard reports unless you define them. However, additional measures will still need to be taken to extract meaning from their reports, such as custom explorations or reports.
What It Means: Events allow you to discover which elements your site users interact with most and which aren’t as successful. This enables you to better optimize your site to improve user conversions.
Tip: If certain events generate poor results, then it’s time to do a full-scale analysis of your user flow and UX design. Perhaps users are having trouble finding certain buttons or are unsure of their purpose. Consider running user surveys to find out where potential trouble spots and frustrations are happening so that you can better optimize your site.
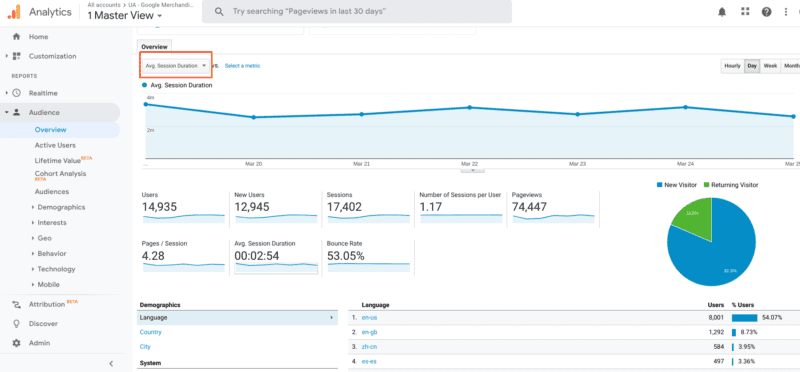
Sessions Per User
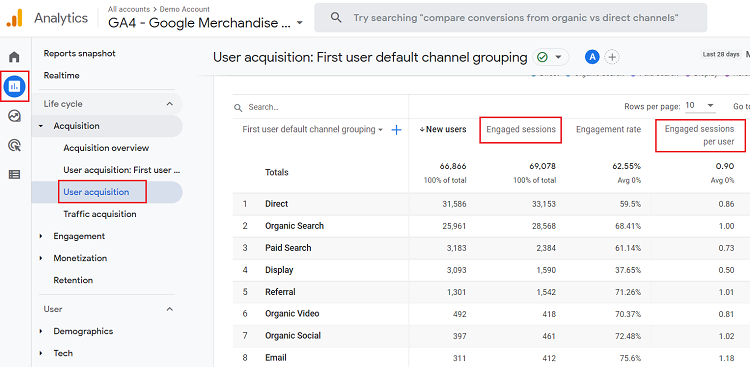
What It Is: In a nutshell, this metric quantifies how often users return to your website. It’s a measurement of the average number of unique visits a person makes within a certain time period and is calculated by dividing a website’s total sessions by the number of users.
What It Means: Sessions per user are a valuable tool for gauging brand loyalty. If customers are continually returning to your website, then it means they’re interested in your products, mission, or overall messaging and that something about your brand is really sticking with them.
Tip: If your sessions per user number are low, then it’s time to rethink the ways your website and marketing strategy are equipped to hook your audience back for more. This could take the form of a weekly blog, new and exciting monthly product launches, or some type of special promotional deals that are blasted out via your email newsletter.
Pageviews
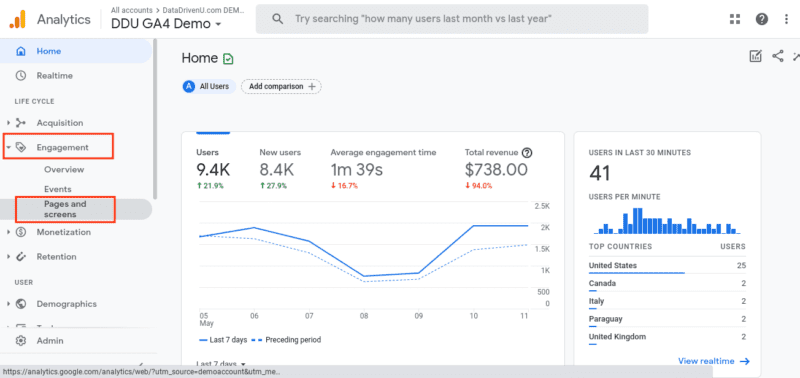
What It Is: Anytime a page loads for a user, it’s considered one pageview. Pageviews is a metric that measures the total amount of times a particular page is seen by visitors. While a single user may have multiple pageviews, when they visit 5 or more pages, it’s then referred to as a session. While UA used to track web and app page views separately, GA4 now combines both statistics together.
What It Means: Page views are the perfect metric for deciphering what’s popular on your website. It shows which pages are resonating with users and which pages might be getting lost in the shuffle.
Tip: There are certain pages that you can expect to receive fewer views than others—for instance, the “About Us” page. And that’s not really anything to be concerned about. BUT, if vital pages, such as your cart checkout page, your contact forms, or your newsletter subscription forms aren’t being found, then it’s time to take a look at your site and understand what’s going on beneath the surface, whether it’s loading difficulties, poor site architecture, or something else.
Final Thoughts
Honestly, Google’s metrics aren’t exactly easy to decipher, and with the latest GA4 changes, it’s understandable if you’re still having trouble keeping up with all of the changes.
Website metrics aren’t just about collecting data; they’re also about making informed decisions to drive business growth. With these insights, you can refine your social media strategy, optimize campaigns, and maximize your return on investment. Remember, in the world of websites, what gets measured gets managed, and what gets managed gets results.

If you’d like some extra help cutting through the madness, the team at Tangible is happy to lend a hand. We stay on top of the latest changes in website analytics so that you don’t have to, ensuring that your site is optimized at every turn. Contact us today to schedule your free consultation!
Time for business.
Leave the marketing to us.
Don’t be shy—set up a free discovery session with our team today!